Live Routes weird behavour


It sounds to me like some websocket issue.
Yes, you said that in the other thread I posted.
But this issue is only introduced with using the new 6.10.0 tracker-web code, it doesn’t happen with 6.7.3.
Further it also happens with out any reverse proxy’s. Ie, my localhost wsl dev instance, and also a vanilla test instance on the same network.
The behaviour seems to happen when the chrome tab is backgrounded, or not the active window. Coming back to the browser window after some time is what I believe is the way to reproduce the issue.
As mentioned before, in dev tools, networking tab, there is multiple socket lines in the network tab being spawned over time. So I don’t doubt it’s a web socket issue, but it’s not a networking / reverse proxy issue, but rather browser behaviour issue of how it’s handling the newer tracker-web code. 6.7.3 does not do this. A backgrounded 6.7.3 browser only remained to have 1 socket line in dev tools networking tab.
There’s even instances where there is multiple live tails overlaying which creates a triangle shaped live trails if the vehicle isn’t on a straight line. Will attempt to capture an image of that again.
What exactly do you see in the browser network tab? Are there any errors? Why WebSockets recorrect?
Have you tried to pinpoint specific server version? That might help us find the right change.
I've just started my PC again for the day, I'll leave the the multiple browser instances running with the dev tools open to capture screenshots to better explain what i see in the network tab.
The test version scenario's I've got are.
- test deployed docker instance running 6.10.0 docker image, running behind reverse proxy with websockets
- locally deployed docker instance running 6.10.0 docker image, on the same network (no reverse proxy, just direct network access to IP port 8080)
- localhost traccar-web instance on 6.10.0 branch (npm run start) connected to production instance 6.7.3 (production api configured in vite.config.js is accessed via reverse proxy with websockets enabled)
All 3 scenario's above exhibit the behaviour, which is at least pointing to the web client, rather than the server api code changes.
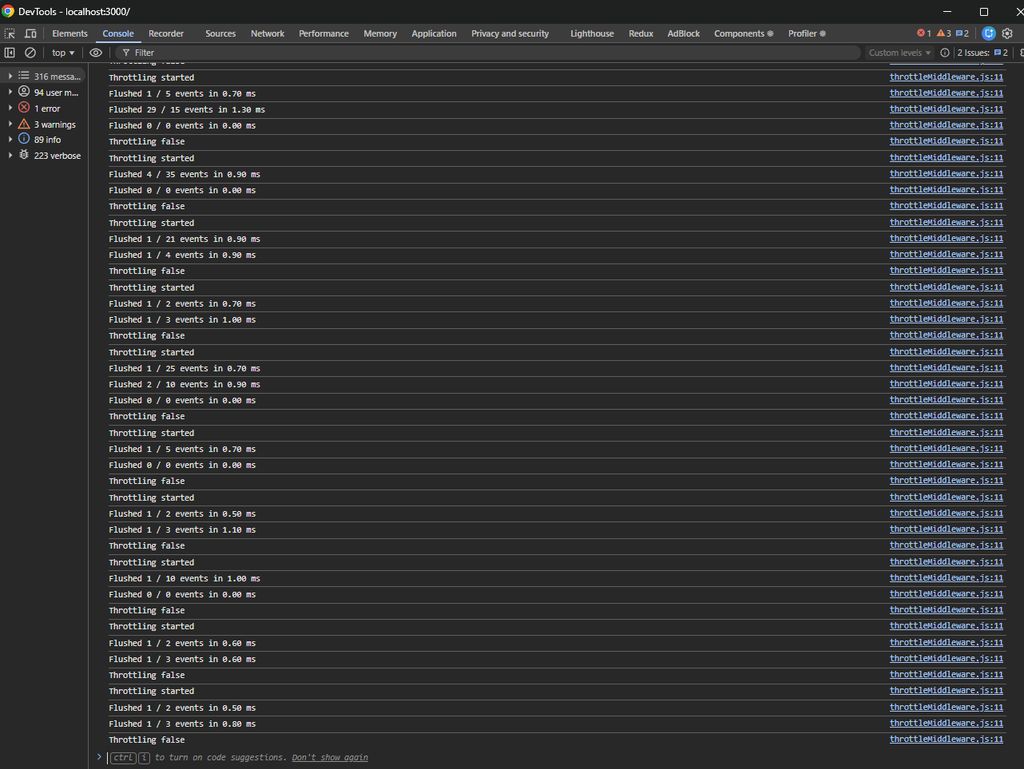
In the local dev instance dev console, I did see a heap of throttling started / flushed x events in x ms messages associated to the throttleMiddleware.js. Could be related as I note that has changed in v6.8.0.
I will come back in a couple of hours with screenshots of what i see in devtools console/network tabs. I will then switch my local branch to v6.8.0 to see if it exhibits the same behavour to try and pinpoint which version specifically.
My Prod 6.7.3 instance - as expected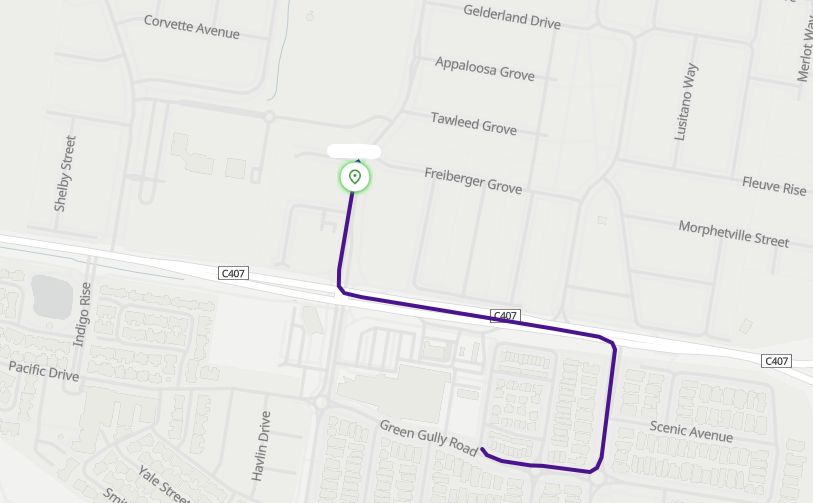
my localhost instance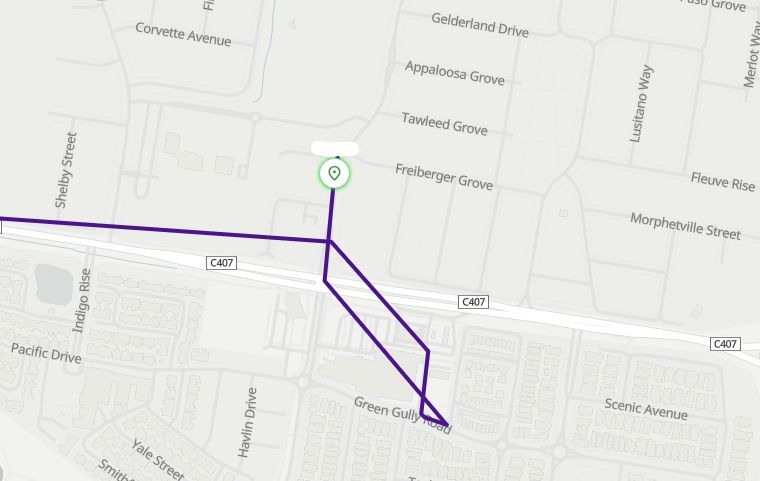
chrome dev tools network and console tab showing multiple socket instances, some in pending?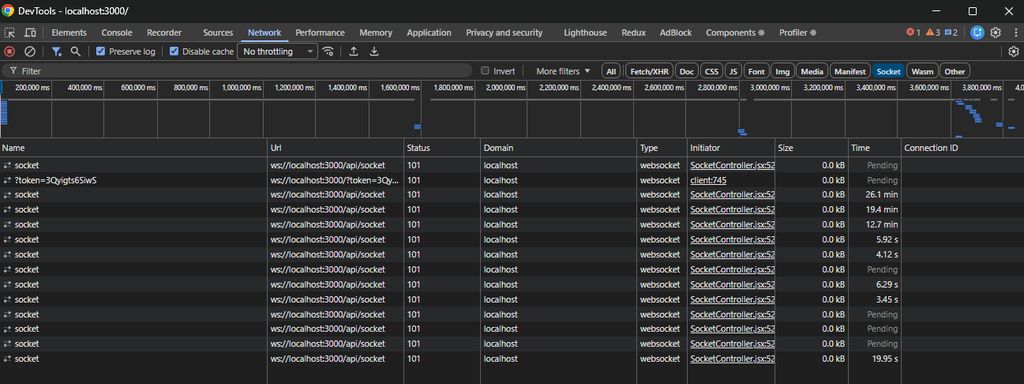
my local docker instance (no reverse proxy, direct IP / port 8080)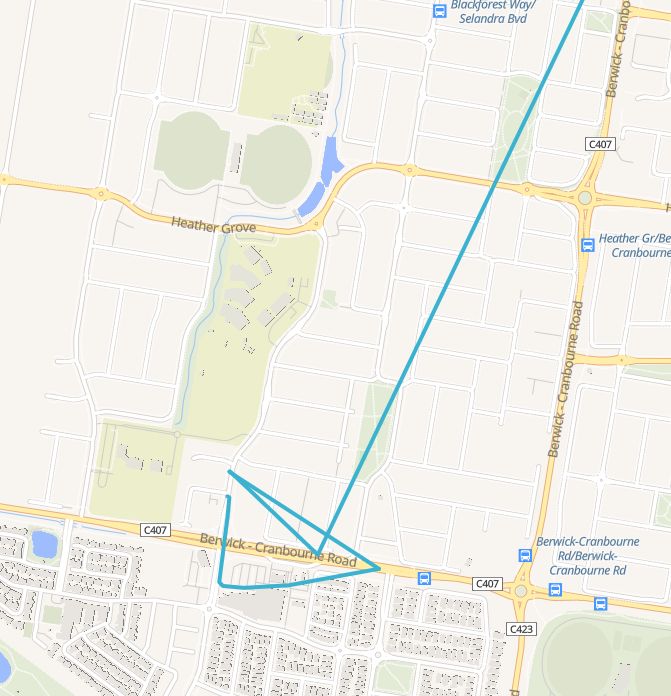
There only appears to be a single socket connection in devtools, however the behaviour is still consistent. because docker deployment, no console debug messages showing throttling.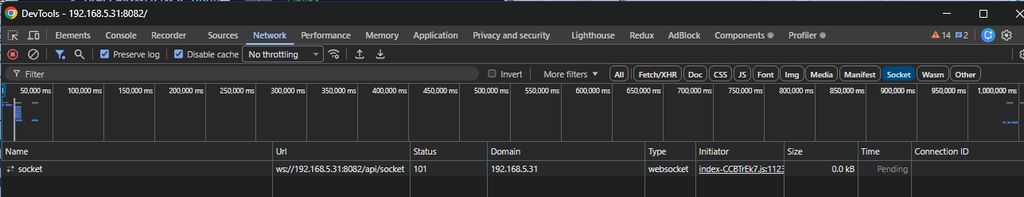
So yes, the local wsl dev instance is accessing my production api via reverse proxy which could be contributing to the multiple socket connections, the local docker instance is exhibiting the same behaviour, with only a single socket connection (still in pending).
And further, Whilst watching the the docker instance chrome browser in real time, the live route appeared as it should.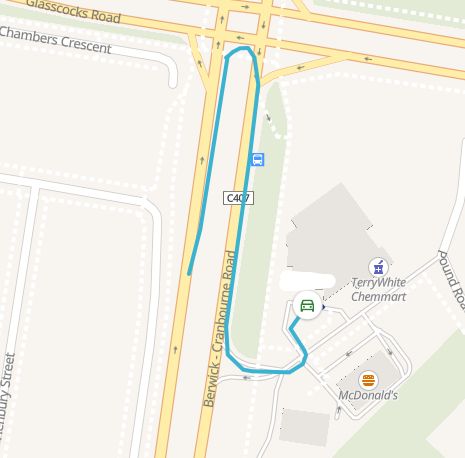
So I believe the way to reproduce this is, connect to the traccar web page, and then minimise the chrome browser. Wait some time for vehicles to move, then maximise the chrome browser window to see low resolution / as the crow flies tracking like this one that was minimised.
Have you checked logs to see what you're actually getting from the device?
I’m not sure how that’s relevant because if I goto reports and trip or replay, I see the full detail points in every single instance above. No position data is lost.
That's relevant because the order of incoming data matters for live route, but not for historical report.
So right now, I've got Teltonika devices, configured to send oldest points first, to a another server endpoint as UDP. That server end point then clones the UDP message and sends it to each of these traccar instances I am testing with. The data received should be identical and in order across all instances. I will confirm via logs shortly.
Further, my prod instance server of 6.7.3, where I have both its built 6.7.3 traccar-web instance, as well as my localhost 6.10.0 pointing to the 6.7.3 prod instance api. If points were indeed were arriving out of order, wouldn't the 6.7.3 web instance show that in its live routes?
I'm going to switch my local branch to 6.8 now to see at what point this behaviour was introduced.
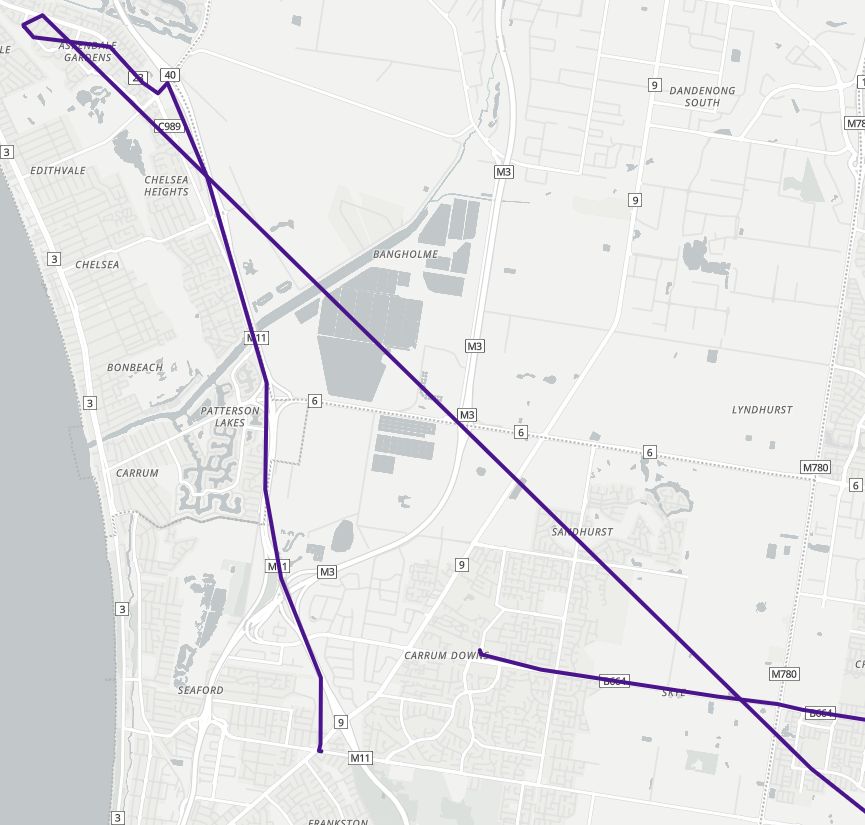
Ok. First image prod 6.7.3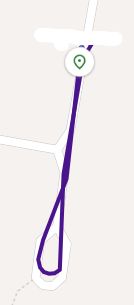
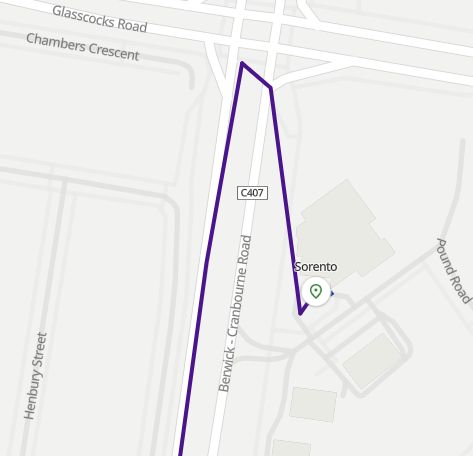
this is 6.8.0 traccar-web pointing at prod 6.7.3 api above.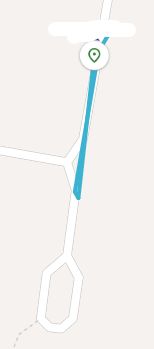
Logs showing data appearing in order for this imei on the prod server where the 6.8.0 traccar-web is pointing to.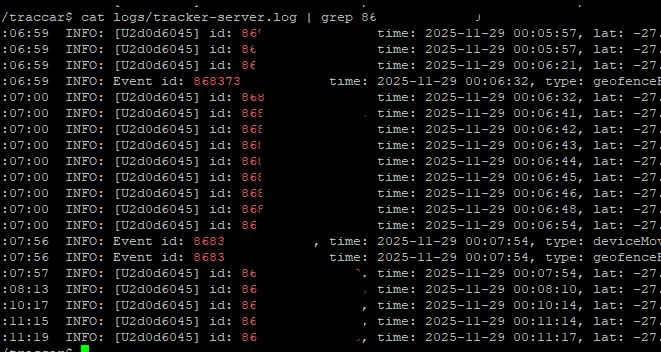
So it appears the behaviour began in 6.8.0 branch of traccar-web
Can you compare what you get in the logs with what you get in the websocket?
Also, did you see any throttling in console?
Recently upgraded our development and test servers from version 6.7.3, to 6.10.0 and noticed the Live routes have a problem.
I saw this post which gives an similar visual experience, the live traces are lacking detail, and appear very as the crow flies, rather than the real position detail as per the replay/trips. https://www.traccar.org/forums/topic/delay-in-displaying-the-position-in-the-live-view/ but that talks about websockets, and our dev server is localhost on wsl, and our test server is an unmodified docker deployment of 6.10.0. so there is no reverse proxy to consider lack of websockets. (on that note, i have left developer tools open on a 6.10.0 web browser instance and see multiple socket ws connections (101 status). however on a 6.7.3 browser instance, there is only 1 socket connection (101 status)).
I'm not sure exactly how to replicate it exactly, because if i'm watching a vehicle in real time, the live routes appear to work fine. It seems when I leave my machine (locked), and then later return to my PC, the live traces are missing heaps of resolution of tracking points, and they do not appear to be cleaning themselves up.
ie, here is a image of approx 20KM of live routes that are still visible on the screen
here is another example.
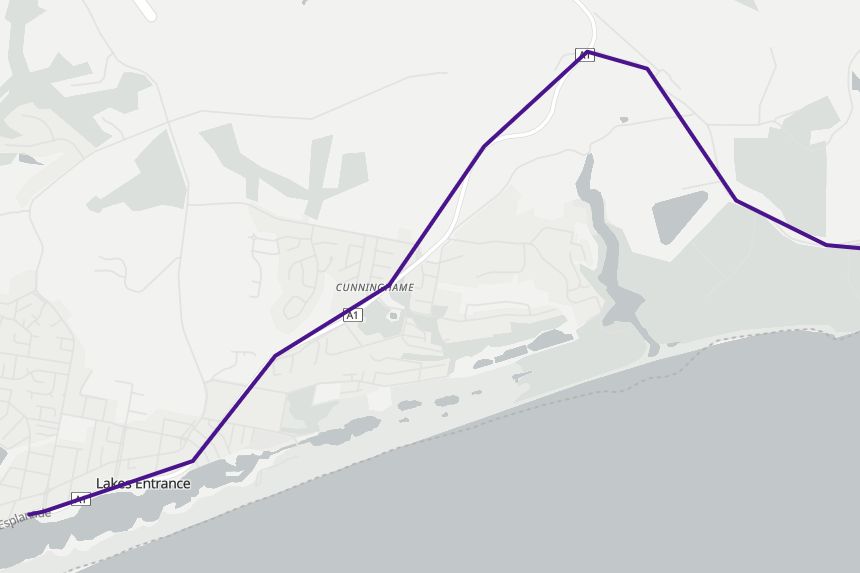
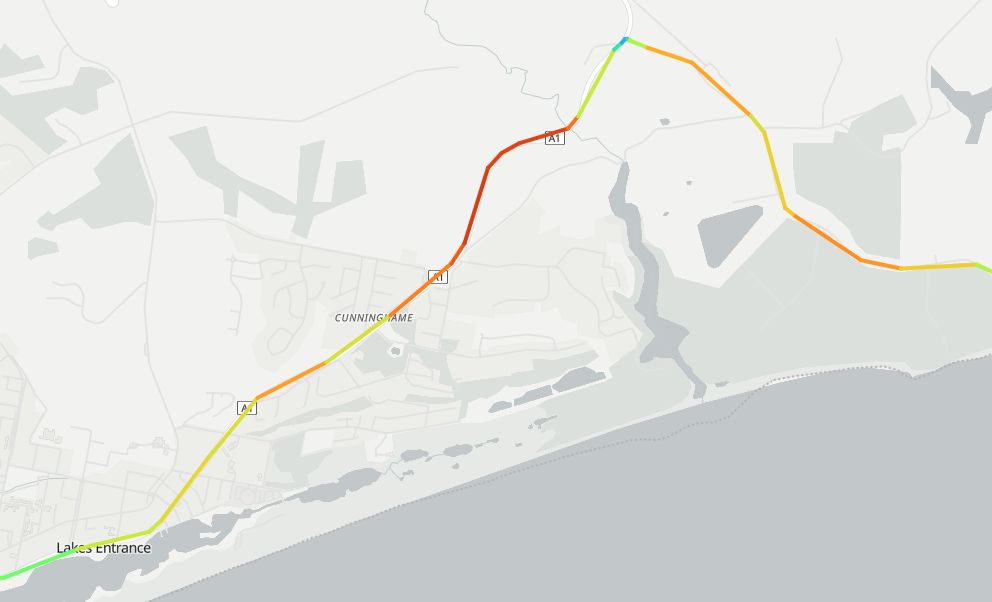
and for reference, here is the same route from the trip report showing how many position points are missing
I do have Web: Live route length attribute set to 20 points. and when watching it in real time, it appears to be a detailed 20 points, as mentioned, when coming back to my pc, it still appears to be 20 points, but lacking alot of details in between.
I have also pointed a 6.10.0 traccar-web deployment at a 6.7.3 production server api instance, and I see the exact same result. So the problem is not on the traccar server api, but appears to be whatever changed going from 6.7.3 -> 6.10.0 in the traccar-web code.