Live Routes weird behavour


OK, this explains it. There is throttling in the web app when you have too many updates per second.
Looking at the network tab, as mentioned, multiple socket connection, however only 2 in a "pending" state.
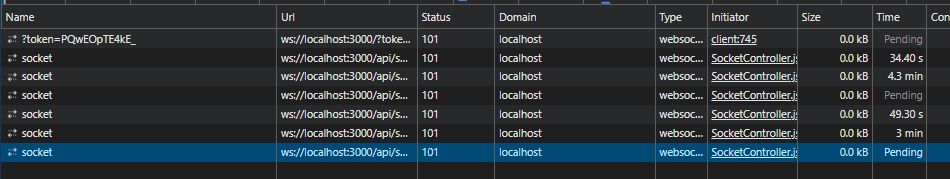
I cleared messages in each, and it appears both pending sockets are getting the same messages. duplicated messages.
Too many updates per second? This test login I'm using only has one active device.
Let me disable the throttling in the code then, removing the throttleMiddleware.
export default configureStore({
  reducer,
  middleware: (getDefaultMiddleware) => getDefaultMiddleware(),
});
Ok, I can confirm that the throttling was causing the live route issues by disabling it as above. Why is it so aggressive? its not actually throttling data coming from the socket, but rather reducing client side reducers updates?
However, still of concern is that there are multiple spawned socket connections all with duplicate messages. Right now with the web browser minimised there is 6 pending connections, at least 4 of them duplicating message data arriving. I do note in the 6.8.0 change log there were to the SocketController, with a introduction of a useEffect to reconnect if needed.
One interesting behaviour i noticed is that every time I tab to another chrome tab, and back to the 6.8.0 traccar-web chrome tab(Not alt tab, but rather switch between tabs within chrome). The existing socket changes from pending, to closed, but a new socket is created with pending. Which I assume is expected behaviour.
However if you wait (even whilst it is the active tab), you will see new sockets spawning to pending state as well. So something is triggering to open more sockets post switching away / to the 6.8.0 browser tab multiple times.
Could the throttleMiddleware artificially aggressive due to 4x sockets of duplicate data coming in compounding the issue?
Here is one of those "triangle polygons" I mentioned.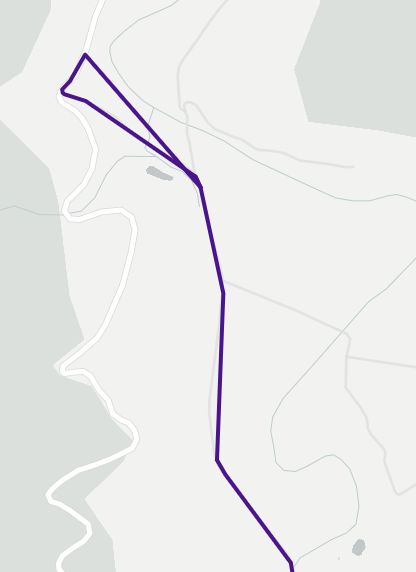
And another from Edge I also had running.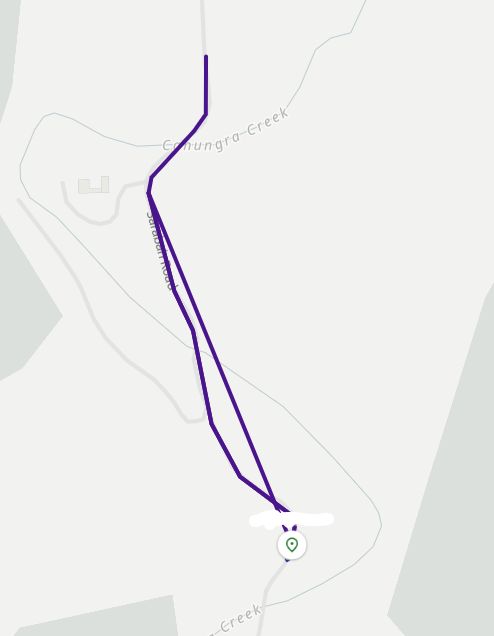
This is what it should look like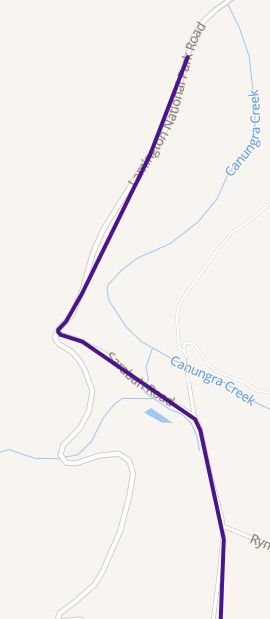
Right now I have disabled the above throttling code.
Based on what I've learnt so far, I feel this might be related to multiple active socket connections with incoming duplicate data. I'm wondering if this might be Cloud flare doing something. The local Docker 6.10.0 does not exhibit this socket close / respawn behaviour. Only instances pointed to my prod instance which is CF dns proxy -> Nginx reverse proxy.
Either way, 6.7.3 traccar-web did not exhibit this problem spawning additional socket connections.
I wasn't able to reproduce the WebSocket issues, but added some safeguards to avoid multiple connections:
https://github.com/traccar/traccar-web/commit/5eb5bdeec82762035705d4cab6b370df59b4ec14
Based on the testing, it looks like the additional socket connection spawning is only present where Cloudflare is used. Ruled out Nginx config.
Running this patch now, will provide feedback shortly.
Hi Anton. FYI, your patch seemed to fix the constant spawning of additional socket connections.
I left Dev tools open all day. Socket remains open whilst the browser is minimized, as soon as I switch back, that socket closes, and shortly after, anther one opened. As a result, I also did not see any "triangle" polylines, which I assume was due to multiple sockets receiving duplicate data.
As mentioned previously, I believe its related to Cloudflare used as a DNS Proxy / waf etc. my local test hosts did not exhibit the multiple spawn websocket sessions issue.
I will go back and re-enable the rate limiting, and see if that behaves now.
Thanks for the update.
In terms of the throttling. I still find it too aggressive with the threshold set at 3 per second.
How was this value of 3 decided upon?
Should this be configurable as a config file option instead of hard coding it into the throttlemiddleware.js web code?
It's just the number that worked well in our tests, but I think making it configurable is a good idea. Probably not in the configuration file though.
Well, you only need to consider the default config on a Teltonika, with 10degree angle changes, and 100m distance. it would very easily pass the 3 per second threshold just turning a corner (which is what I witnessed).
As a server level attribute would be a good idea. also possibly user level as well
Right now i am watching that one vehicle's messages coming in the logs as its traveling, and its individual/single messages, all in order.
In the production web interface 6.7.3 works as expected. I switch to the web interface of 6.8.0, and it has missing live route points.
However, if I stay in the web browser of 6.8.0, the live routes works correctly with full detail. If I switch to the main web browser page for a while, and then come back to the 6.8.0 browser, all points generated in my "absence" are jagged/missing points.
Further, with the 6.8.0 browser minimised, I can see its dev tools Console messages fill with Throttling started messages. ie,.
When I switch to the 6.8.0 chrome browser tab, all the throttling console messages stop and live routes continue working as expected (although there is missing points from before).
Switch away to a different browser tab, and the console logs start again.
So, it appears this is easily reproduceable. It appears to happen when the associated chrome browser window is not active / minimised / etc.
The same behavour happens with MS Edge, when minimized after a few minutes, you see the Throttling started console messages.