Operating System(OS): ubuntu
System spec. using lshw -short & lscpu: Image
OS Version Details :
- Distributor ID:
Ubuntu
- Description:
Ubuntu 16.04.6 LTS
- Release:
16.04
- Codename:
xenial
Number of devices/trackers: 8
Server UP/Running time: Almost 9 days
CPU usage by traccar-server(JAVA-process): 98.00 - 99.97
PID of the top thread(JAVA) is: 21582 , HEX Value: 0x544E
In stack dump 0x544E refers to:
- io.netty.channel.*
- io.netty.util.*
To identify the thread followed steps in: Link
Image of my top using top -H: 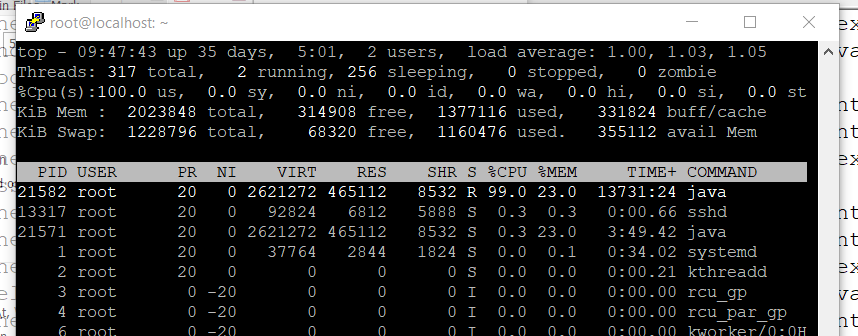
Complete stack dump of this process using jstack: thread-stack.txt
Any ideas whats the issue? why traccar using too much CPU and made server halt ?
any suggestions or information is appreciate. thanks
PS: if any other information required i'll be happy to share :)
yes apparently there isn't any error in logs except from these two
- geocoder (Reverse-engineering) =>
429 Too Many Requests
- computed-attribute calculation =>
org.traccar.handler.ComputedAttributesHandler.computeAttribute@104![0,4]: 'adc0 * 5;' undefined variable adc0
but there is one thing more, take a look this might help threadDump.txt


Operating System(OS):
ubuntuSystem spec. using
lshw -short&lscpu: ImageOS Version Details :
UbuntuUbuntu 16.04.6 LTS16.04xenialNumber of devices/trackers:
8Server UP/Running time:
Almost 9 daysCPU usage by traccar-server(JAVA-process):
98.00 - 99.97PID of the top thread(JAVA) is:
21582, HEX Value:0x544EIn stack dump
0x544Erefers to:To identify the thread followed steps in: Link
Image of my top using
top -H:Complete stack dump of this process using
jstack: thread-stack.txtAny ideas whats the issue? why traccar using too much CPU and made server halt ?
any suggestions or information is appreciate. thanks
PS: if any other information required i'll be happy to share :)